
Built for Engineers
Designed with engineers in mind, CANCapture is a flexible, powerful and cost-effective software application for capturing and analyzing traffic on a CAN bus.
The Right Tool for the Job

CANCapture uses the ECOM cable, a USB 2.0 high-speed device that allows CAN traffic to be transmitted and received using a computer or laptop. Originally designed by EControls to provide a CAN interface for OEM customers to communicate with our ECUs, it is now available to anyone for custom software development.

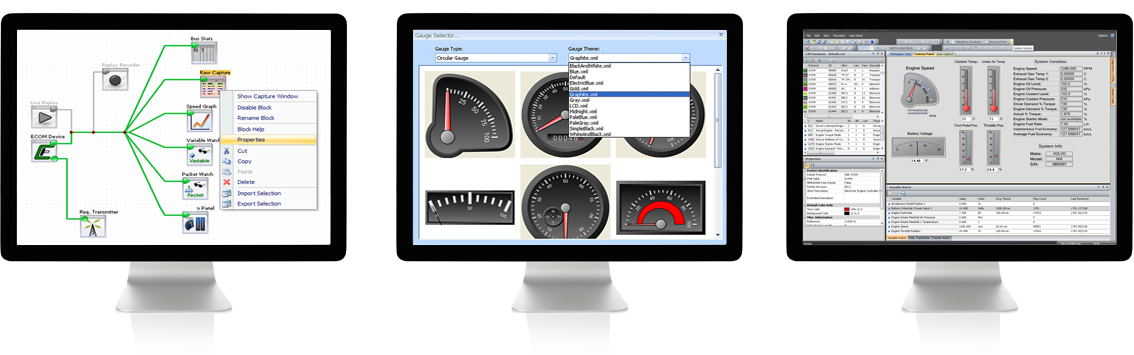
For one low price, you get both the hardware and software needed to get started. CANCapture includes features such as custom scripting, J1939 support, CAN database importing and professional user panels. Featuring fully customizable data flow management, CANCapture allows easy set up to load and modify the CAN database. It allows connecting or disconnecting functional blocks without stopping the live capture - by connecting multiple ECOM devices in the flow chart, create virtual gateways that can bridge, manipulate, filter and analyze activity between buses.